Salesforce Developer Console for Apex, SOQL, SOSL and debug logs
Salesforce Developer Console is a browser-based development environment available inside a Salesforce org. It is used to create, edit, test and debug Salesforce application components such as Apex classes, Apex triggers, Visualforce pages, Visualforce components and static resources. It is also a practical place to run SOQL queries, run SOSL searches, execute anonymous Apex and inspect debug logs.
Use the Developer Console for quick investigation, small code changes, query checks and log review. For larger source-controlled projects, many teams use Salesforce CLI and Visual Studio Code, but the Developer Console remains useful when you need to work directly in a browser-based Salesforce session.
Where to open Salesforce Developer Console in Lightning Experience and Salesforce Classic
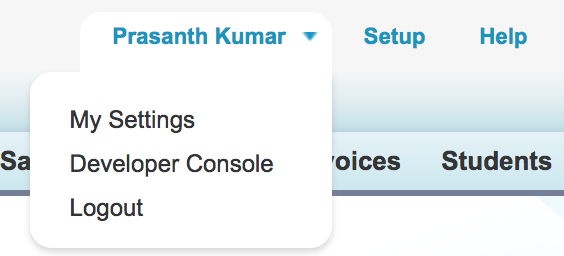
To open Salesforce Developer Console in Lightning Experience, click the Setup gear icon and then click Developer Console. In Salesforce Classic, click Your Name | Developer Console. The console opens in a separate browser window, so allow pop-ups for your Salesforce domain if the window does not appear.
After the Salesforce Developer Console opens, you will see the menu bar, a workspace area with tabs, and lower panels for logs, tests, checkpoints, query editor, progress and problems. Each file, query result, log or test view opens as a tab in the workspace.
Salesforce Developer Console menu bar, workspace and lower panels
The Developer Console user interface is organized around a few areas that you will use repeatedly while working with Apex, Visualforce, SOQL and debug logs.
- File menu :- We can create new apex class, Apex trigger, Visualforce page, Visualforce components, Static resource and many more.
- Edit menu : Using edit menu we find text in the current view, Find / Replace. Find / Replace All / Search in files and fix indentation.
- Debug Tab : We can open new window to enter apex code for testing using execute anonymous windows and can execute last Apex code.
- Workspace : Workspace in developer console is a collection of resources represented by tabs in the main panel. Here we can create new workspace, can switch workspace, can rename current workspace and can delete workspaces.
- Help : Here help documents, shortcut keys and preferences settings will be available.
| Developer Console area | What you use it for in Salesforce |
|---|---|
| Menu bar | Create files, save changes, execute Apex, manage logs, run tests and adjust preferences. |
| Workspace tabs | Open Apex classes, triggers, Visualforce pages, query results and debug logs in separate tabs. |
| Logs tab | Review execution logs for Apex, workflow, validation rules, database operations and callouts. |
| Tests tab | Run Apex test classes and review test execution status. |
| Problems tab | Find compilation errors and issues in the currently opened resources. |
| Query Editor tab | Run SOQL queries and SOSL searches against data in your Salesforce org. |
Create a Visualforce page in Salesforce Developer Console
Using developer console in Salesforce we can create Apex Class, Apex Trigger, Visualforce page, Visualforce Component, Static resources, Lightning application and many more as show below.
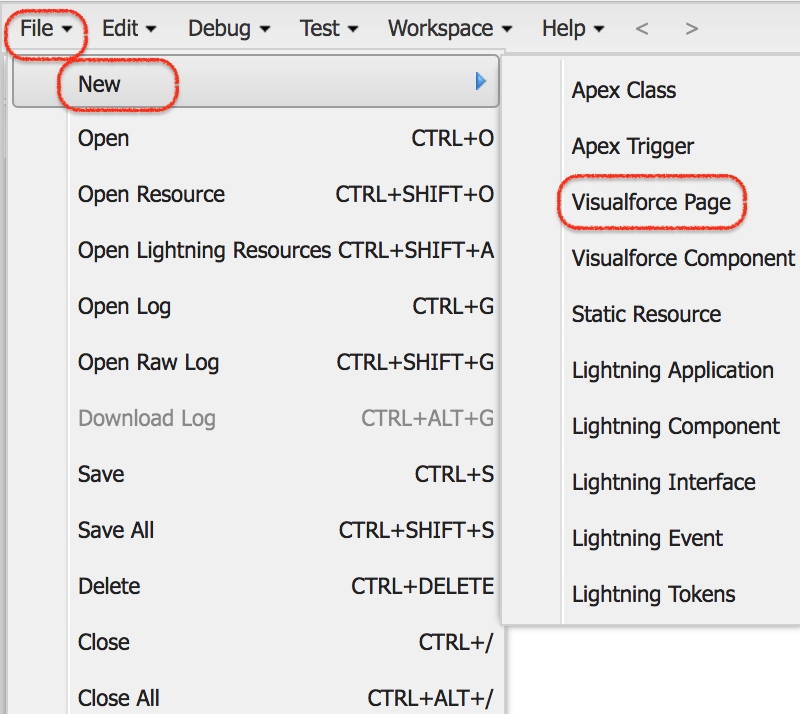
To create new Visualforce page in Salesforce developer console navigate to File | New | Visualforce page. Enter the page name, click OK, write the Visualforce markup in the workspace and save the page.
A simple Visualforce page can be used to check that the page opens correctly and can access standard global variables such as the current user.
<apex:page>
    <h1>Hello {!$User.FirstName}</h1>
    <p>This Visualforce page was created from Salesforce Developer Console.</p>
</apex:page>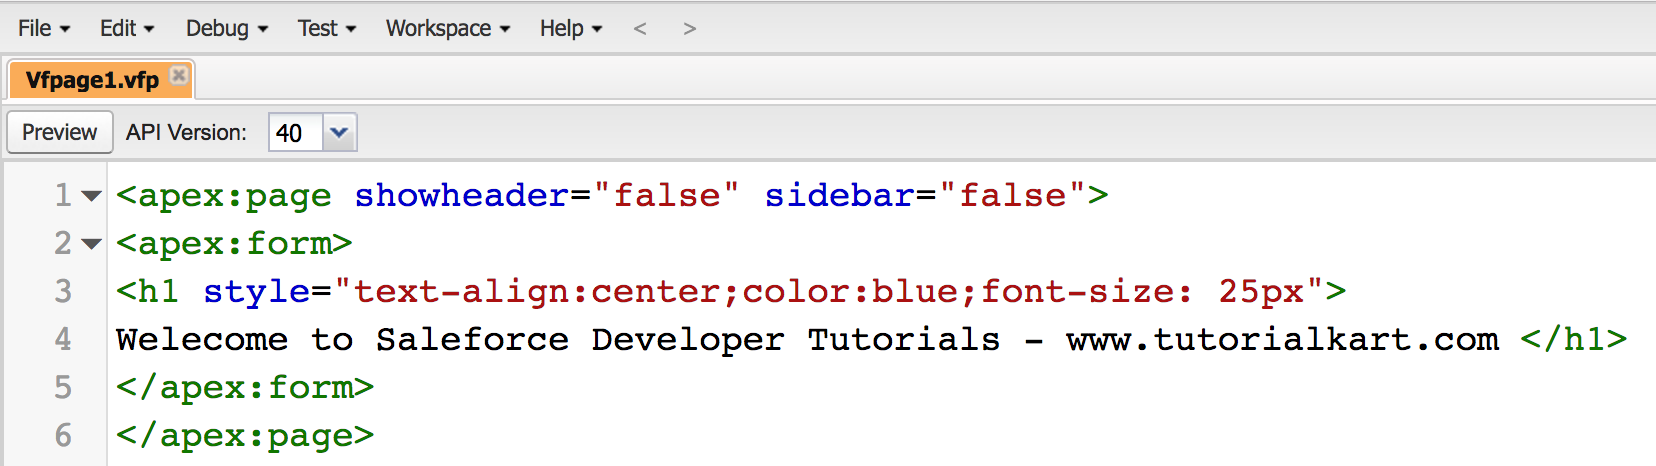
To execute or preview the Visualforce page, click the Preview button. Salesforce opens the Visualforce page in a new browser window. If the preview window does not open, check the browser pop-up setting for your Salesforce domain.
Run anonymous Apex code in Salesforce Developer Console
Anonymous Apex is useful when you need to test a small piece of Apex logic, inspect records with System.debug(), or manually start a controlled Apex operation. Use this carefully in production because anonymous Apex can perform data changes if your code includes DML statements such as insert, update or delete.
- Open Debug | Open Execute Anonymous Window.
- Enter the Apex code you want to run.
- Select Open Log if you want the debug log to open after execution.
- Click Execute.
- Review the generated log in the Logs tab.
The following anonymous Apex example queries a few Account records and writes their names to the debug log. It does not modify data.
List<Account> accounts = [
    SELECT Id, Name
    FROM Account
    ORDER BY Name
    LIMIT 5
];

for (Account acc : accounts) {
    System.debug('Account Name: ' + acc.Name);
}
If you cannot execute anonymous Apex, check that your user has the required development permissions for your org. In many Salesforce setups, anonymous Apex execution requires permissions such as API Enabled and Author Apex.
Execute SOQL query in Salesforce Developer Console Query Editor
To execute SOQL and SOSL queries in Salesforce developer console click on Query Editor tab.
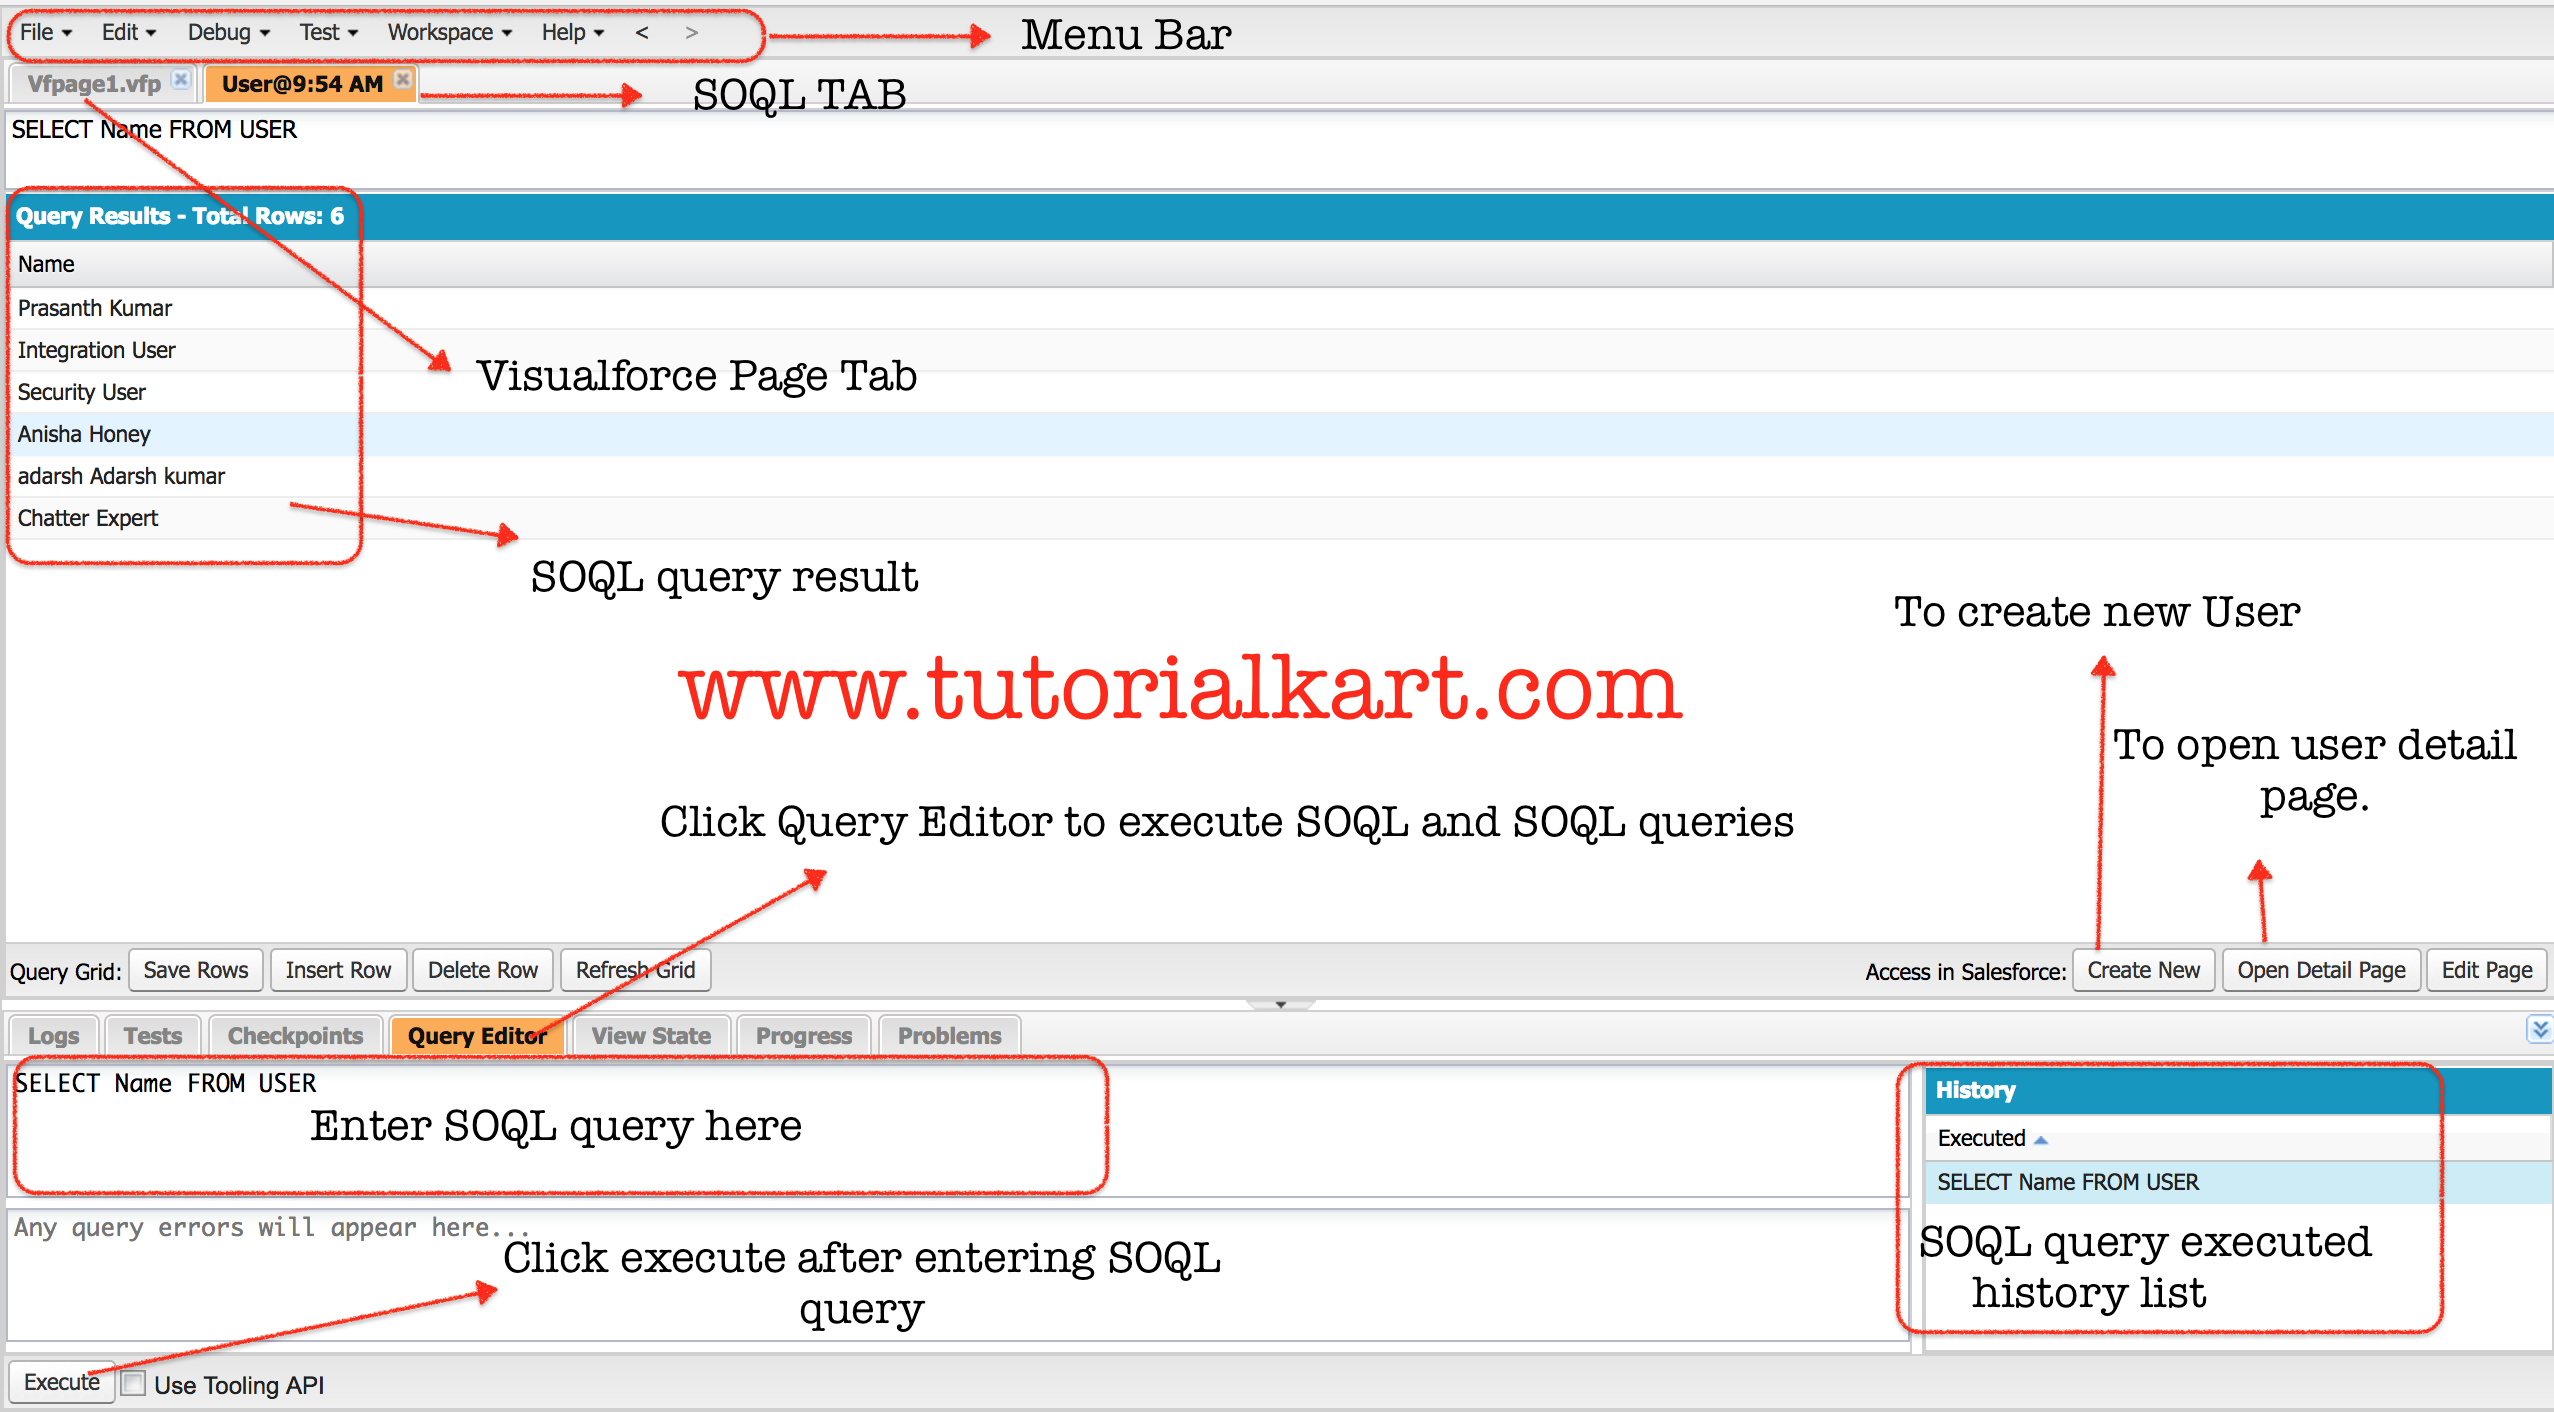
A new workspace will be displayed to enter SOQL query as shown above.
Enter SOQL query.
Click on execute button.
Run the following SOQL Query.
SELECT Name FROM USERAs shown above SOQL query, all user names in the organization will be extracted and displayed in the SOQL query result. For every function in Developer console, a new tab will be opened below the menu bar.
For day-to-day checks, add the fields you need and use a LIMIT clause while testing. This keeps the result grid smaller and makes the query easier to review.
SELECT Id, Name, Email
FROM User
WHERE IsActive = true
ORDER BY Name
LIMIT 10
The Query Editor can run SOQL queries for object data and SOSL searches for text search across objects. If you are querying tooling or metadata-related objects, select Use Tooling API before you execute the query.
Read Salesforce Developer Console query results and errors
- Query Results grid: Shows returned rows and columns after the query runs successfully.
- Error message area: Shows syntax errors, invalid field names, missing object permissions or malformed query messages.
- Use Tooling API checkbox: Use this only when you intentionally query Tooling API objects instead of ordinary Salesforce data objects.
- Unsaved grid changes: Avoid relying on manual edits in the result grid because rerunning a query can clear unsaved changes.
Use Salesforce Developer Console logs to debug Apex
The Logs tab is one of the most useful parts of Salesforce Developer Console. When you run anonymous Apex, preview a Visualforce page, save code or execute business logic, Salesforce can generate a debug log. Open the log to inspect method execution, database events, validation rule behavior, workflow or flow actions, callouts and exceptions.
- Run the action that you want to debug.
- Open the latest entry in the Logs tab.
- Search for
USER_DEBUGto find yourSystem.debug()statements. - Look for exception lines if the transaction failed.
- Use the Problems tab to check compile-time issues in open Apex or Visualforce files.
For example, if the anonymous Apex example above runs successfully and Open Log is selected, the log will contain lines similar to the following.
USER_DEBUG|[8]|DEBUG|Account Name: Acme
USER_DEBUG|[8]|DEBUG|Account Name: Edge Communications
Run Apex tests from Salesforce Developer Console
Salesforce Developer Console can run Apex tests and display test status in the Tests tab. This is helpful after you edit an Apex class, create a trigger or need to confirm that existing automation still works as expected.
- Open Test | New Run.
- Select the test class or test methods to run.
- Click Run.
- Review the result in the Tests tab.
- If a test fails, open the related log and review the failure message and stack trace.
When you are learning Apex, write test methods for any class or trigger that changes data. The Developer Console helps you run those tests quickly, but the code still needs to follow Salesforce test and deployment requirements.
Common Salesforce Developer Console tasks and when to use them
| Task in Developer Console | Best use case | Menu or tab |
|---|---|---|
| Create an Apex class | Small class, quick example, or learning exercise in a sandbox or Developer Edition org. | File | New | Apex Class |
| Create an Apex trigger | Trigger practice or small trigger edit after checking object and field names. | File | New | Apex Trigger |
| Create a Visualforce page | Visualforce examples, admin utility pages, or legacy Visualforce maintenance. | File | New | Visualforce Page |
| Run anonymous Apex | Quick read-only checks, debug statements, or carefully controlled admin scripts. | Debug | Open Execute Anonymous Window |
| Run SOQL or SOSL | Check data, validate field names, inspect record values and test query filters. | Query Editor |
| Review debug logs | Find Apex exceptions, debug output, database operations and automation behavior. | Logs |
| Run Apex tests | Confirm that Apex changes pass selected tests before deployment or review. | Test | New Run |
Salesforce Developer Console troubleshooting checks
- Developer Console window does not open: Allow pop-ups for the Salesforce domain and try opening it again from the Setup gear menu.
- SOQL query fails: Check object API name, field API names, commas, relationship names and whether your user has access to the queried data.
- Anonymous Apex fails: Review the exception in the log and confirm that the code compiles before executing it again.
- Apex class does not save: Open the Problems tab and fix compile errors, missing semicolons, invalid references or incorrect method signatures.
- Debug log is too noisy: Use focused
System.debug()messages and review the latest log generated by your own action.
Salesforce Developer Console practice checklist before changing an org
- Confirm whether you are working in a sandbox, Developer Edition org or production org.
- Use read-only SOQL examples first, especially when learning the Query Editor.
- Add
LIMITwhile testing a query so that the result grid stays manageable. - Check user permissions before running anonymous Apex or saving Apex code.
- Review the Logs, Tests and Problems tabs before considering a change complete.
FAQs on Salesforce Developer Console, SOQL and anonymous Apex
How do I open Developer Console in Salesforce Lightning Experience?
In Lightning Experience, click the Setup gear icon and select Developer Console. The console opens in a separate browser window, so browser pop-ups must be allowed for your Salesforce domain.
Can Salesforce Developer Console run both SOQL and SOSL?
Yes. Use the Query Editor tab to run SOQL queries for Salesforce object data and SOSL searches for text search across one or more objects.
What permissions are needed to execute anonymous Apex?
Anonymous Apex execution generally requires development permissions such as API Enabled and Author Apex. The exact access available to you depends on the permissions assigned by your Salesforce administrator.
Why is Salesforce Developer Console not opening?
The most common reason is that the browser blocks the separate Developer Console window. Allow pop-ups for your Salesforce domain, refresh Salesforce, and open Developer Console again from the Setup gear menu or from your name in Salesforce Classic.
Is Developer Console enough for all Salesforce development?
Developer Console is useful for quick Apex, Visualforce, SOQL, SOSL, logs and tests. For larger team projects, source control, Salesforce DX and Visual Studio Code are usually more suitable.
Official Salesforce Developer Console references
- Salesforce Help: Developer Console
- Salesforce Help: Open the Developer Console
- Salesforce Help: Executing Anonymous Apex Code
- Salesforce Trailhead: Learn to Use the Developer Console Effectively
Salesforce Developer Console next steps for Apex and SOQL practice
In this Salesforce Developer Tutorial, we learned how to use Salesforce Developer Console to open a workspace, create a Visualforce page, run SOQL queries, execute anonymous Apex, read logs and run Apex tests. Continue with small read-only examples first, then move to Apex classes, triggers and test methods in a sandbox or Developer Edition org.