Salesforce Reports: Creating Different Salesforce Reports
Salesforce reports are used to view, filter, group, and summarize records stored in Salesforce. They help users convert business questions into report tables, charts, and Dashboards. In this Salesforce tutorial, we will learn about creating different Salesforce reports such as Tabular Reports, Summary Reports, Joined Reports, and Matrix reports.
This guide also explains report folders, report types, filters, dashboard settings, and the practical difference between tabular, summary, matrix, and joined report formats.
What is a Report in Salesforce?
A report in Salesforce is a filtered list of records displayed in rows and columns. Report data can be filtered, grouped, summarized, sorted, and displayed with charts when the selected report format supports it. Salesforce reports are commonly used for sales pipeline analysis, service case tracking, activity monitoring, campaign performance, and operational review.
Every report is based on a report type. The report type decides which object records, relationships, and fields are available in the report builder. For example, an Opportunities report type gives access to opportunity records and related opportunity fields, while an Accounts with Contacts report type gives access to account and related contact data.
Salesforce standard reports, custom reports, and custom report types
In Salesforce reporting, it is useful to separate three ideas: standard reports, custom reports, and custom report types.
- Standard reports are reports or reporting options provided by Salesforce for common objects and business needs. They are useful when the standard fields and relationships meet your requirement.
- Custom reports are reports created by users from available report types. Users can add columns, filters, groupings, charts, and summaries based on permissions.
- Custom report types define custom object relationships and field availability for reports. They are created when standard report types do not provide the exact object relationship required for reporting.
Before creating a report, confirm that the correct report type exists. If a user cannot find the needed fields or related records in the report builder, the issue is often with the chosen report type, not with the report format.
How to create Salesforce reports custom folder?
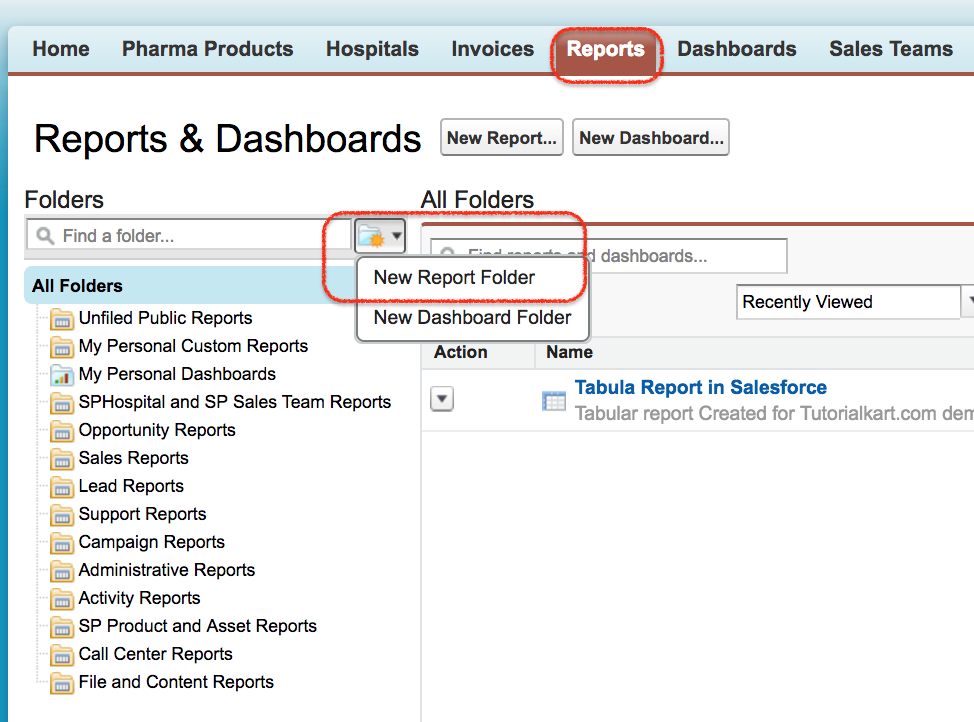
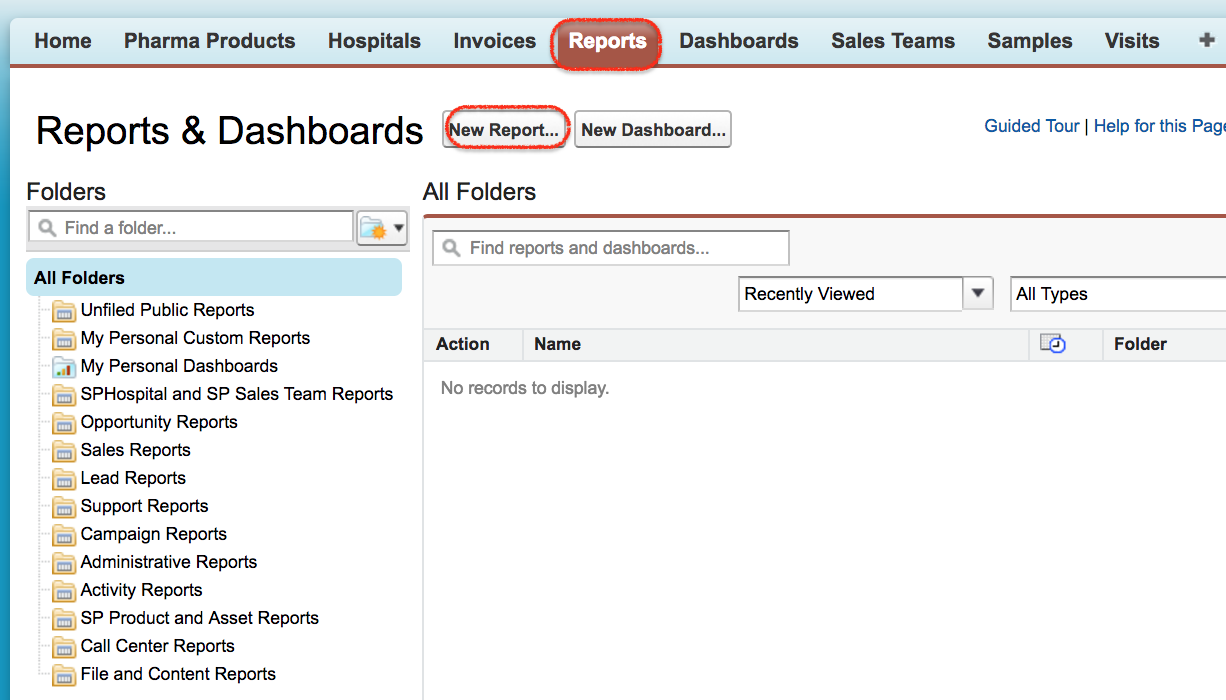
A report folder is used to organize reports and control who can access them. To create a custom reports folder, login to Salesforce.com and navigate to Setup | Reports | New report folder.
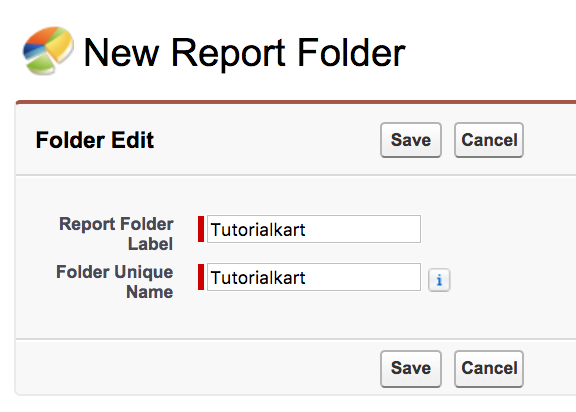
- Enter report folder name and unique name as desired.
- Click on Save button.
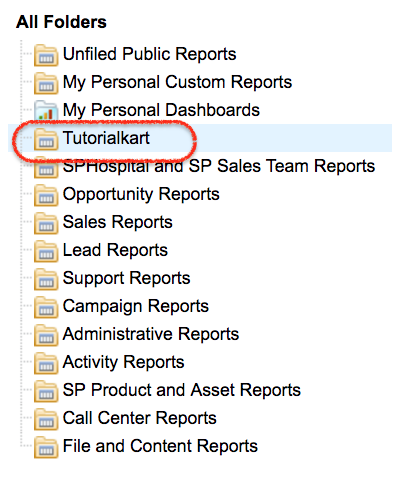
As shown below, the Tutorialkart report folder has been created successfully. We can move custom Salesforce reports from My Personal Custom Reports to the Tutorialkart report folder.
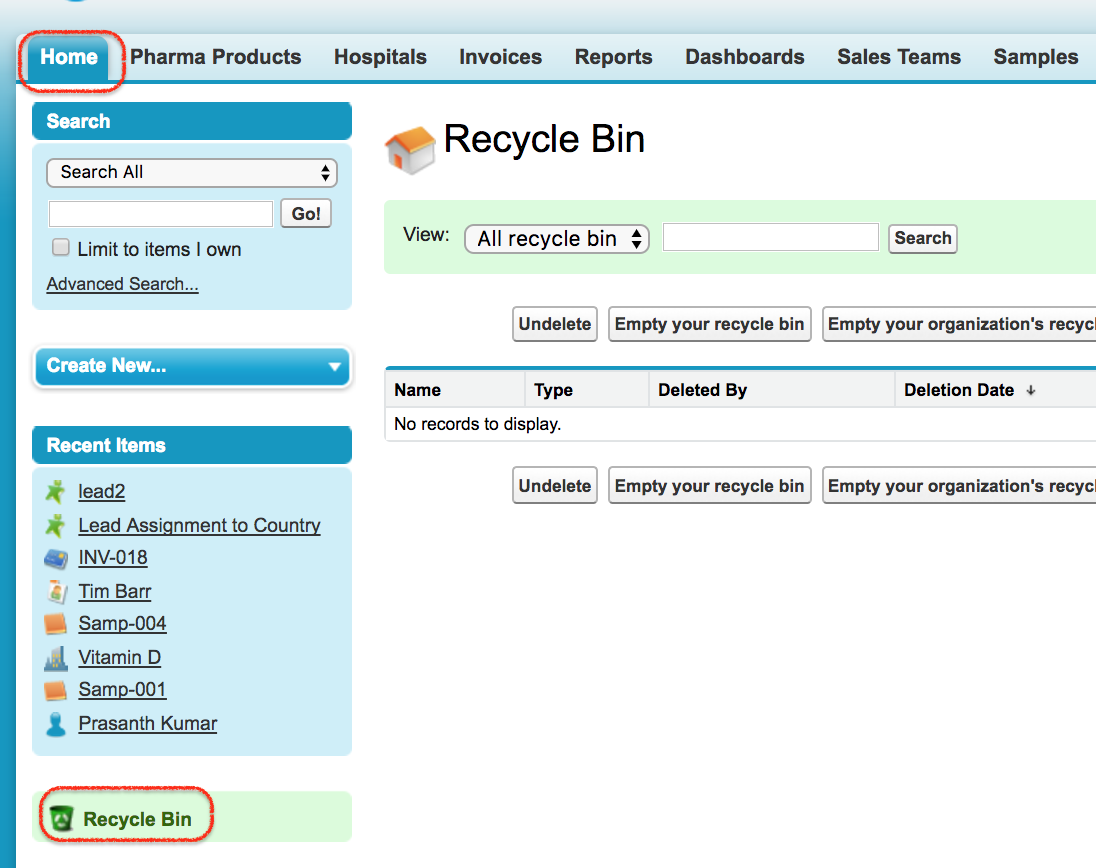
Salesforce reports and dashboards can be deleted and can be retrieved from Recycle Bin if they are still available there.
Salesforce report formats: tabular, summary, matrix, and joined reports
Salesforce reports can be created in different formats depending on how the data must be displayed and summarized.
| Salesforce report format | How the report displays data | Best used for |
|---|---|---|
| Tabular Report | Displays records in simple rows and columns. | Simple lists such as closed won opportunities, open cases, or accounts by owner. |
| Summary Report | Groups rows and shows subtotals by group. | Pipeline by stage, cases by priority, revenue by owner. |
| Matrix Report | Groups records by both rows and columns. | Comparing totals across two dimensions, such as stage by close month. |
| Joined Report | Combines multiple report blocks in one report view. | Comparing related or different data sets side by side. |
Tabular Reports :- Tabular Reports in Salesforce are the most basic and simplest report format. Fields are listed in columns and records are listed in rows. A tabular report is useful for record lists. When a tabular report is used for a dashboard table component, dashboard settings and row limits may be required depending on the dashboard component.
Summary Reports :- A Summary Report allows users to group rows of data. It supports sorting, grouping, subtotals, and charts. Summary reports are commonly used for dashboards because they provide summarized business information.
Matrix Report :- A Matrix Report summarizes data in a grid format. Matrix reports allow records to be grouped by both rows and columns. This format is useful when the report must compare values across two fields.
Joined Report :- A Joined Report contains multiple report blocks that provide different views of data in the same report. Each block can have its own fields, columns, sorting, and filtering. A joined report can also use different report types when the selected objects and relationships support the reporting requirement.
Salesforce report builder areas used while creating reports
To create Salesforce reports, login to Salesforce.com and navigate to Reports | New Report | Select report type | Create. In some older Salesforce screens, this option may be reached from Setup | Reports.
When creating a new Salesforce report, different sections are available in the report builder as shown below.
- Control Area.
- Quick find.
- Data tab.
- Standard Filter Area.
- Report filter area.
- Report data preview area.
- Report Selection.
These areas are used to select fields, apply filters, group records, preview results, run the report, and save the finished report in the correct folder.
How to create Tabular report format in Salesforce
To create Tabular Report in Salesforce, login Salesforce with username and password. Now Navigate to Setup | Reports.
- Now Click on New report as shown above.
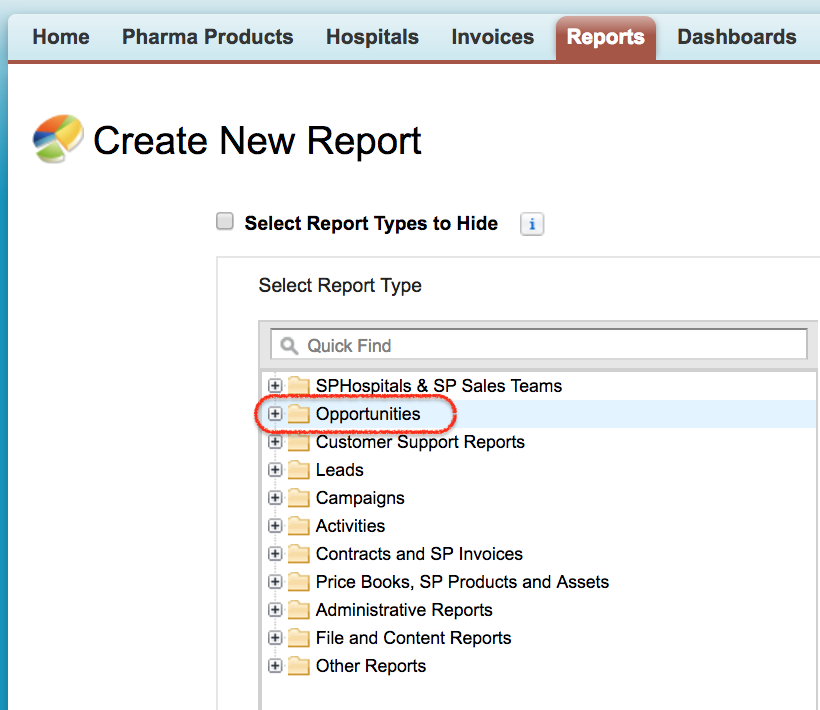
Select the report type that has to be created. In this Salesforce tutorial, we are creating a Tabular report for Opportunities.
- Click on Create button.
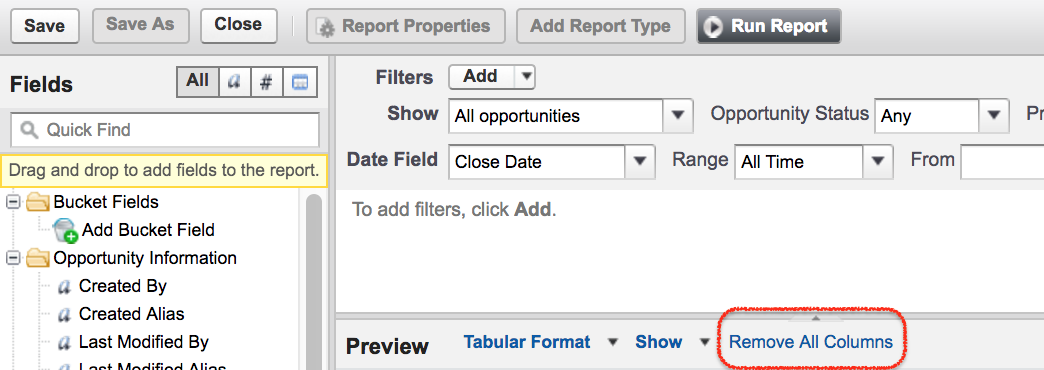
- In Standard filter area, select Show All Opportunities and Opportunity Status as Any, clear date ranges, and select range as All Time as shown above.
- Click on Remove All Columns to clear default columns.
- Now select the fields from the data tab.
- Drag and drop the fields to the columns.
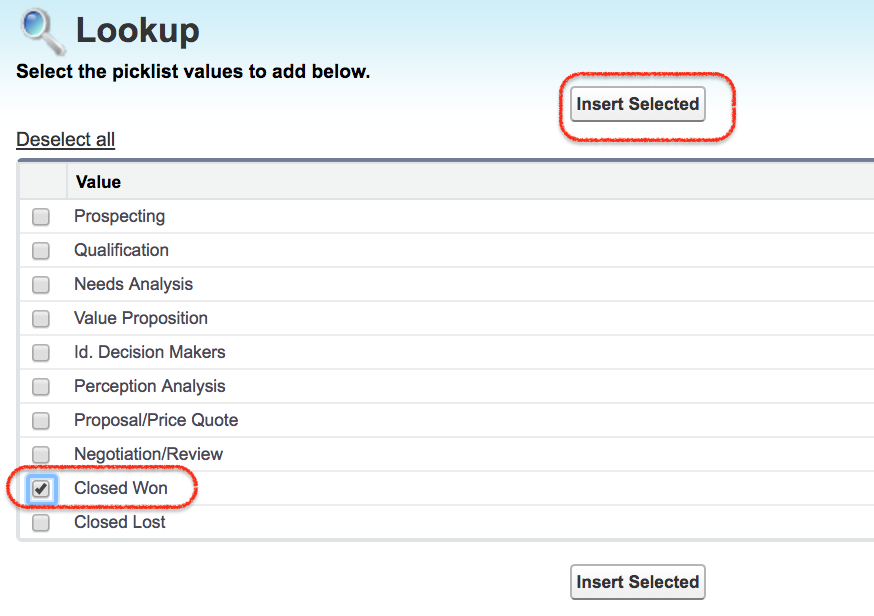
- Now add a filter to display opportunities where Stage equals Closed Won.
- Select Stage equals Closed Won as shown below.
- Select Closed Won and click on Insert Selected.
- As shown below, we have selected four fields to the column area.
For a tabular report that must be used in a dashboard table component, define a row limit. Click on Filter and add row limit. Enter maximum of 99 for limit and click on Ok button. When generating dashboards, row limits are required for certain tabular report dashboard settings. Otherwise, the required Dashboard Settings option may not appear for the tabular report.
- After adding row limit, a new tab called Dashboard Settings will appear as shown above.
- Click on Dashboard Settings to setup name and value which will be used in dashboards.
- Number and currency fields are only available for Value.
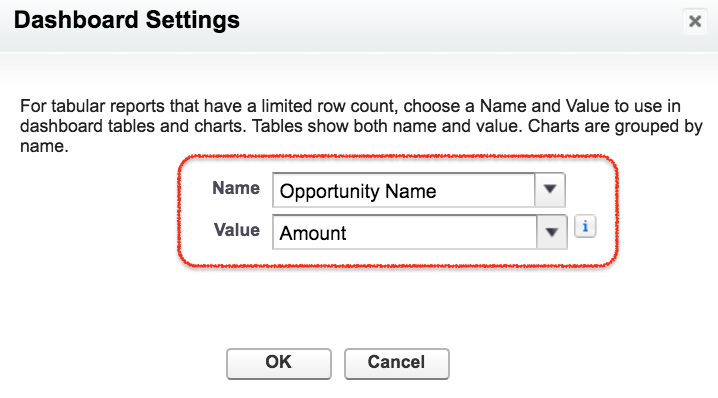
- Enter name as Opportunity Name and value as Amount.
- Click on Ok button.
- Now click on Run report.
- Now all opportunities of type Closed Won will be displayed in tabular format as shown below.
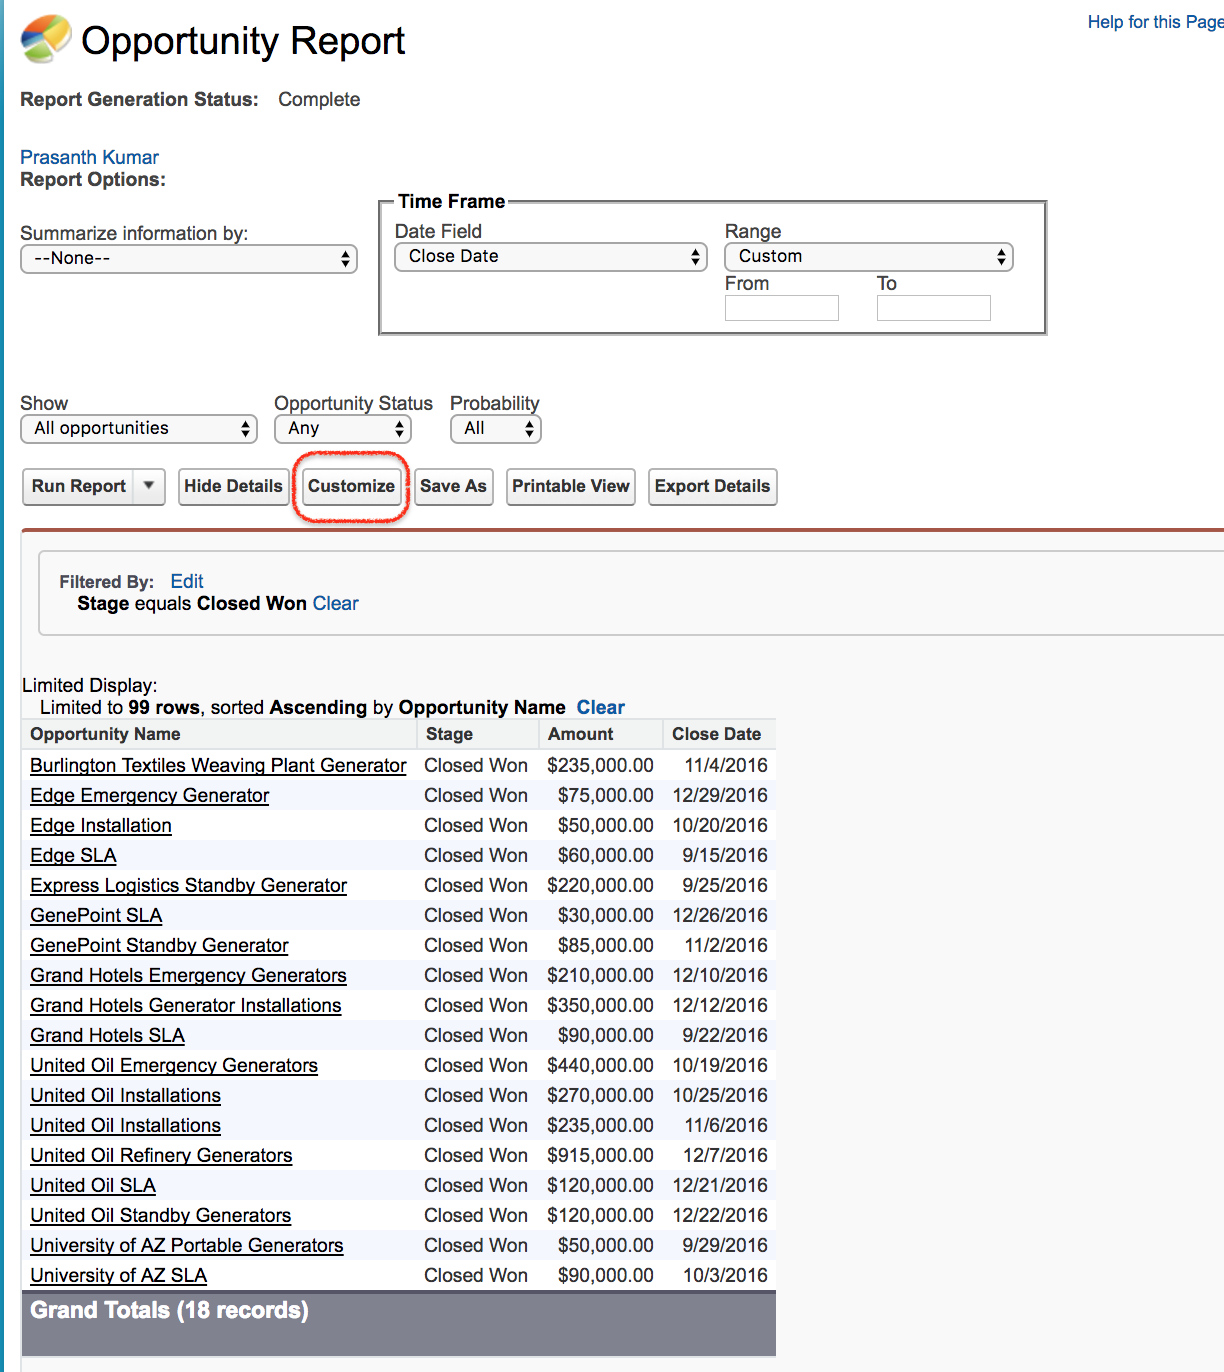
All opportunities are created and displayed in tabular format as per criteria.
- Click on Save as button.
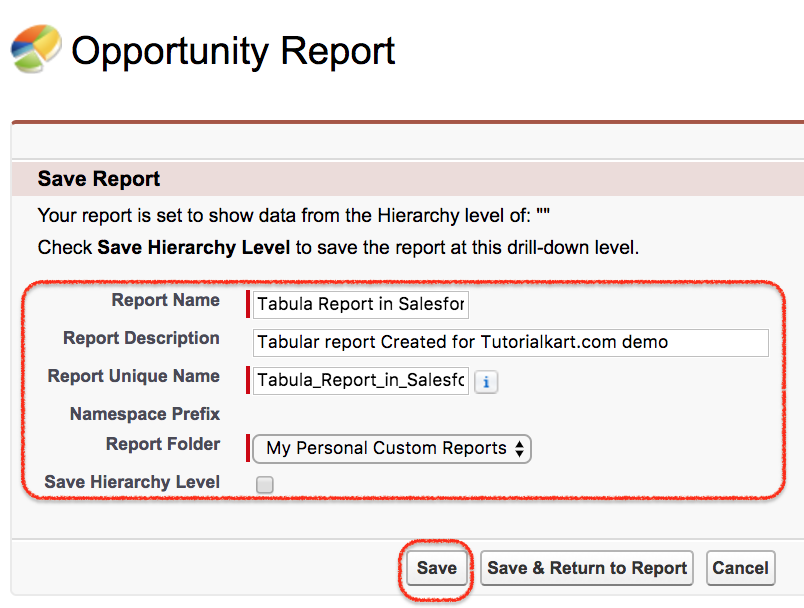
- Enter report name.
- Enter Salesforce Report Description.
- Select Report folder and finally click on Save button.
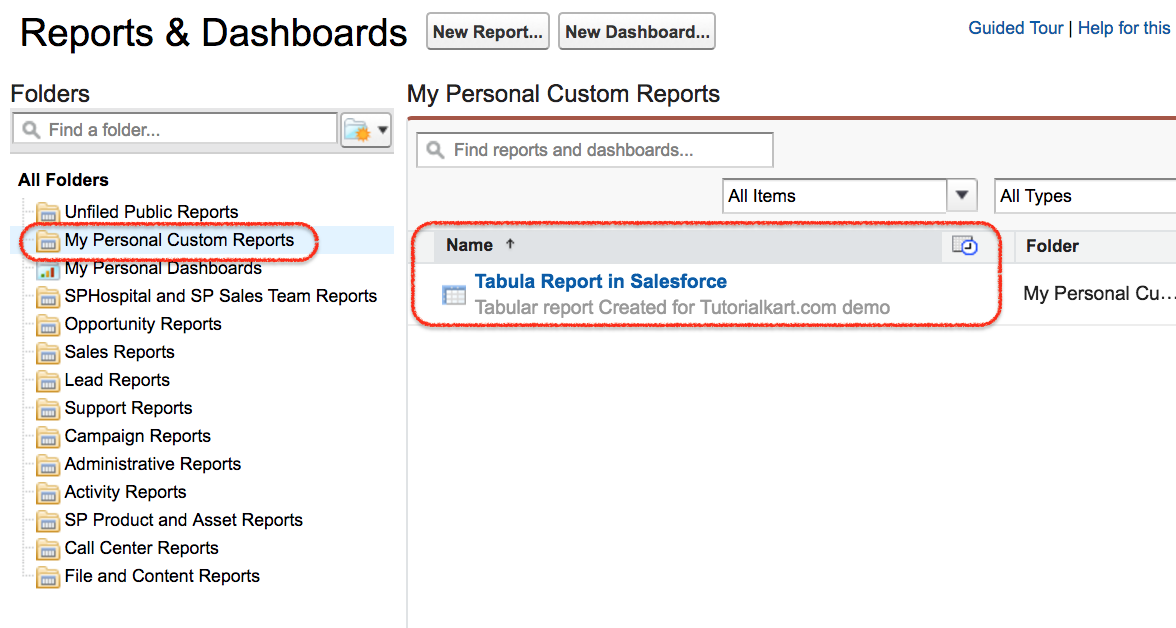
Whenever we access My Personal Custom Report folder, we can see our tabular report.
- To customize Salesforce tabular report, click on report name.
- Now click on report properties.
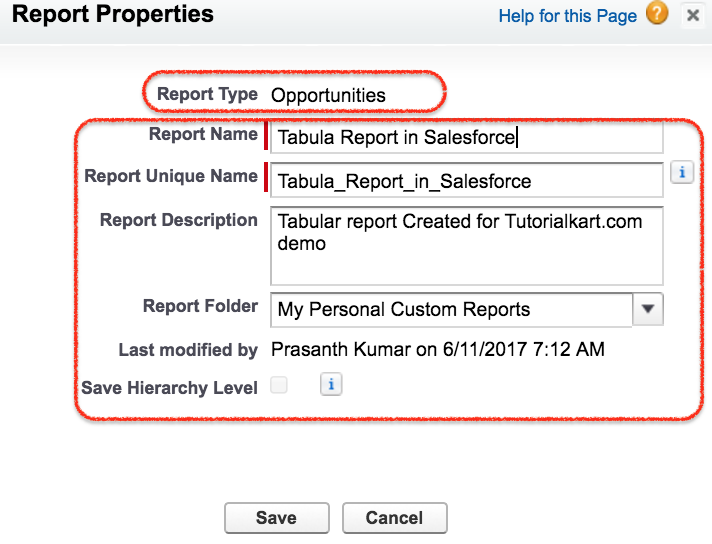
As shown above, details about Salesforce reports like Report Type, Report Name, Unique Name, Description, Report Folder, and Last Modified By are available.
- Finally click on Save button.
We have successfully created Tabular report. Likewise, we can create other Salesforce Reports like Summary Reports, Matrix reports, and Joined Reports.
How to create dynamic Salesforce reports with filters
A dynamic Salesforce report is usually created by applying filters that adjust the displayed records based on the running user, selected values, dates, or business conditions. Common examples include My Opportunities, My Team’s Opportunities, cases owned by the logged-in user, or records closing in the current fiscal quarter.
- Use standard filters such as date range, owner, status, or record scope.
- Use field filters to show only records that match specific values.
- Use relative date filters such as This Month, This Quarter, or Current FY when the report must update automatically over time.
- Use dashboard filters when the same dashboard should allow viewers to change the data view without editing the source reports.
Dynamic filters should be tested with different users because report results depend on object permissions, field-level security, record sharing, role hierarchy, and folder access.
How to duplicate a Salesforce report safely
To create a copy of an existing Salesforce report, open the report and use Save As. Enter a new report name, description, and destination folder. This is useful when the original report is correct but a team needs a slightly different version with changed columns, grouping, or filters.
Before duplicating a report, check the report folder and sharing settings. A copied report saved in a private folder may not be visible to other users, while a copied report saved in a shared folder may be available to a wider group.
When to use joined reports to combine Salesforce report data
Use a joined report when one report view must show multiple blocks of data side by side. For example, a sales manager may compare open opportunities, closed won opportunities, and activities in one report. Each block can have its own columns and filters, while the report still provides one combined reporting view.
A joined report is not always the answer for every combined reporting requirement. If the needed objects are not available through the selected report types or object relationships, a custom report type or a different data model may be required.
Common Salesforce report creation mistakes
- Selecting the wrong report type: If fields or related records are missing, review the report type first.
- Using broad date filters: Reports with All Time date ranges can return too much data and reduce usefulness.
- Saving reports in personal folders: Other users may not be able to access the report unless it is saved in a shared folder.
- Adding too many columns: A report should show fields that answer the business question, not every available field.
- Ignoring user permissions: Users may see different report results depending on sharing settings, object permissions, and field-level security.
Editorial QA checklist for Salesforce reports tutorial
- Verify that the tutorial explains report type before report format, because report type controls available objects and fields.
- Check that tabular, summary, matrix, and joined reports are described with clear use cases.
- Confirm that report folder steps mention access and sharing, not only folder creation.
- Review all dashboard-related statements for the current Salesforce report builder used in the target org.
- Test example filters such as Stage equals Closed Won in a sandbox or training org before using them in production reports.
FAQs on creating different Salesforce reports
What are the different types of reports in Salesforce?
The main Salesforce report formats are tabular reports, summary reports, matrix reports, and joined reports. Tabular reports show simple rows and columns, summary reports group rows, matrix reports group by rows and columns, and joined reports show multiple report blocks in one report.
Can you combine two Salesforce reports?
You can combine different report views by using a joined report when the required report types and relationships are supported. If the objects cannot be combined in a joined report, a custom report type or another reporting approach may be needed.
Can I duplicate a Salesforce report?
Yes. Open the existing report and use Save As to create a copy with a new name, description, and folder. This lets you keep the original report unchanged while creating a modified version.
How do you create dynamic reports in Salesforce?
Create dynamic Salesforce reports by using filters such as owner filters, relative date filters, field filters, and dashboard filters. The report should be tested with different user profiles because permissions and sharing settings can change the records shown.
Why are some fields missing while creating a Salesforce report?
Fields may be missing because the selected report type does not include the object relationship, the user does not have field-level access, or the field is not available for that reporting setup. Check the report type and user permissions before rebuilding the report.