In this Salesforce tutorial, we will learn how Salesforce reports and dashboards help convert business questions into useful data views. At the end of this Salesforce Tutorials page, you will understand Salesforce Reports, Salesforce Dashboards, report types, report formats, dashboard components, and how these tools work with Reports and How to use Salesforce Report builder.
Salesforce Reports and Dashboards Overview
Salesforce reports and dashboards are used to analyze CRM data. A report displays records in rows, columns, groups, and summaries. A dashboard presents report data visually using charts, gauges, metrics, tables, and other components. Together, they help users answer questions such as which opportunities are closing this month, which cases are overdue, which campaigns are generating leads, or how a sales team is performing.
Salesforce describes analytics as a way to explore data, get insights, and take action from within the platform. For deeper product details, you can refer to the official Salesforce Help page on Salesforce analytics and the Salesforce Developer documentation for reports and dashboards concepts.
What Salesforce Reports Do in CRM Data Analysis
Salesforce Reports are used to generate data from Salesforce objects and display that data in a structured format. A report can show fields from records, apply filters, group rows, summarize values, and display charts when the selected format supports them. Reports are commonly used for sales pipeline review, lead tracking, account activity, service case analysis, campaign performance, and administrative monitoring.
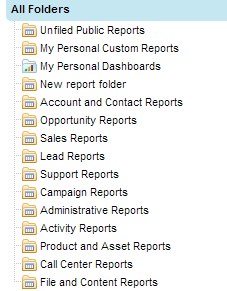
Every report in Salesforce is stored in Folders. Folder access controls who can view, edit, or manage the reports stored inside. A report may be visible to one user, a team, a role hierarchy, or a wider group depending on folder sharing and user permissions.
- Standard Reports.
- Custom Reports.
Standard reports: Standard reports are based on standard Salesforce report types. They are available for common objects and relationships such as Accounts, Contacts, Leads, Opportunities, Activities, Cases, and Campaigns. They help users create reports without first defining a custom report type.
Custom reports: Custom reports are reports created by users or admins for a specific business need. They may use standard report types or custom report types. Custom report types are useful when the business needs to report on custom objects, selected related objects, or a controlled set of fields and relationships.
Salesforce Report Formats: Tabular, Summary, Matrix, and Joined
Salesforce reports can be created in different formats depending on the type of analysis required. Choosing the right format is important because it affects grouping, summaries, charts, and dashboard use.
| Report format | Best use case | Example |
|---|---|---|
| Tabular Report | Simple list of records without grouping | All open leads created this week |
| Summary Report | Grouped records with subtotals | Opportunities grouped by stage and owner |
| Matrix Report | Grouped records by rows and columns | Revenue by sales rep and quarter |
| Joined Report | Multiple report blocks shown together | Accounts with opportunities and cases in separate blocks |
The four commonly used Salesforce report formats are:
- Tabular Reports.
- Summary Reports.
- Matrix Report.
- Joined Report.
How Salesforce Dashboards Display Report Data
Salesforce dashboards are visual representations of report data. A dashboard is made up of components, and each component is usually based on a source report. Dashboards help users read trends and summaries more quickly than scanning individual report rows.
For example, a sales manager may use a dashboard to view total pipeline, closed revenue, top opportunities, win rate, lead conversion, and overdue tasks. A service manager may use a dashboard to view open cases, average resolution time, escalated cases, and support team workload.
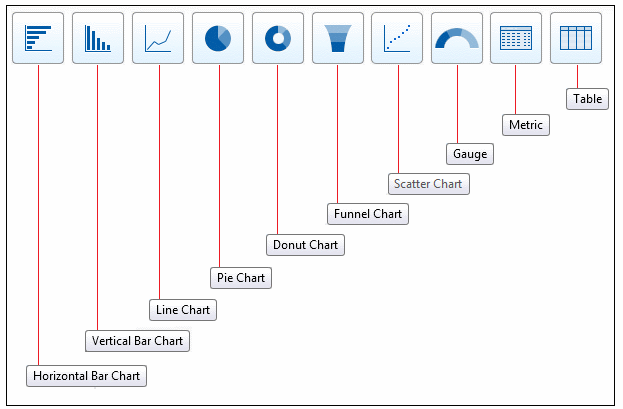
To represent Salesforce dashboards we have to use Dashboard components. Some of them are
| Charts | Gauges | Tables | Metrics |
| Scatter Chart | Funnel Chart | Donut Chart | Pie Chart |
| Line Chart | Vertical bar chart | Horizontal Bar Chart | Visualforce pages |
Salesforce Dashboard Components and When to Use Them
Each Salesforce dashboard component should match the question being answered. A metric is useful for one important number. A gauge is useful for tracking progress against a target. A bar chart is useful for comparing values across categories. A line chart is useful for showing change over time. A table is useful when users still need to see names, owners, dates, or other record details.
| Dashboard component | Use it for | Example CRM question |
|---|---|---|
| Metric | One key number | What is the total pipeline value? |
| Gauge | Progress against a goal | How close are we to the monthly sales target? |
| Bar chart | Comparison across groups | Which owner has the highest open opportunity value? |
| Pie or donut chart | Share of a whole | How are leads distributed by source? |
| Line chart | Trend over time | How has closed revenue changed month by month? |
| Table | Record-level summary | Which high-value opportunities need attention? |
Salesforce Report Types for Objects, Relationships, and Fields
Report types in Salesforce work like templates or frameworks. A report type controls which objects, relationships, and fields are available when a user creates a report. If the right report type is not selected, the report builder may not show the fields or related records required for the business question.
There are two main types of report types in Salesforce:
- Standard Report types and
- Custom Report Types.
Standard report types: Standard report types are provided by Salesforce by default for common objects and relationships. They are suitable for many everyday reporting needs.
There are a number of Standard report types. Some of them are:
| Accounts | Activities | Contacts |
| Call Center Reports | Campaign | Salesforce CRM Content |
| Leads | Opportunities | Pricebook |
| Products | Assets | Administrative Reports |
Custom report types: Custom report types are created by admins when standard report types do not provide the required object relationship or field selection. They are often used for custom objects, custom lookup relationships, and reporting scenarios where the business wants to control which records appear in the report.
Converting Salesforce Business Requirements into Reports and Dashboards
Before building a report or dashboard, write the business requirement as a clear question. Then identify the object, fields, filters, grouping, and visual format needed to answer it. This avoids reports that contain many fields but do not answer the user’s real question.
| Business requirement | Report or dashboard design |
|---|---|
| Show open opportunities closing this month | Opportunity report filtered by close date and open stages |
| Compare revenue by sales rep | Summary report grouped by opportunity owner with amount totals |
| Track leads by source | Lead report grouped by Lead Source and displayed as a bar or donut chart |
| Find overdue cases | Case report filtered by status and due date |
| Monitor monthly sales target | Dashboard gauge or metric based on a summarized opportunity report |
Salesforce Reports and Dashboards Permissions and Folder Access
Reports and dashboards are controlled by a combination of object permissions, field-level security, sharing settings, report folder access, and dashboard folder access. A user must have permission to see the underlying records and fields. Giving access to a report folder does not automatically give access to data the user is not allowed to view.
For dashboards, the running user setting is also important. A dashboard may run as a specified user or as the logged-in user, depending on configuration. This affects what data each viewer sees. Salesforce Trailhead provides a useful guided module on reports and dashboards in Lightning Experience.
Common Mistakes in Salesforce Reports and Dashboards
- Using the wrong report type: The required fields or related records may not appear in the report builder.
- Adding too many columns: A report should answer a business question, not display every available field.
- Missing filters: Without clear filters, reports may include old, closed, inactive, or irrelevant records.
- Choosing the wrong chart: A pie chart is not suitable for trend analysis, and a line chart is not suitable for a single total.
- Ignoring permissions: Users may see different results depending on record access, field access, folder sharing, and dashboard running user settings.
Salesforce Reports and Dashboards Editorial QA Checklist
- Does the report or dashboard answer a specific Salesforce business question?
- Is the correct Salesforce report type selected for the object relationship?
- Are filters, date ranges, groupings, and summary fields clearly defined?
- Does each dashboard component match the data being displayed?
- Have folder access, object permissions, field-level security, and dashboard running user behavior been checked?
Salesforce Reports and Dashboards FAQs
What is the difference between a Salesforce report and a Salesforce dashboard?
A Salesforce report displays CRM data in rows, columns, groups, and summaries. A Salesforce dashboard displays report data visually through components such as charts, metrics, tables, and gauges. Reports are used for detailed analysis, while dashboards are used for quick monitoring and visual review.
Which Salesforce report format should I use for grouped totals?
Use a Summary Report when you need grouped totals such as opportunity amount by stage, cases by owner, or leads by source. Use a Matrix Report when you need grouping by both rows and columns, such as revenue by sales rep and quarter.
Can a Salesforce dashboard show data from multiple reports?
Yes. A Salesforce dashboard can contain multiple components, and each component can be based on a source report. This allows one dashboard to show pipeline, activities, cases, leads, and other metrics together when the underlying reports are configured correctly.
Why are users seeing different Salesforce dashboard results?
Users may see different dashboard results because of record sharing, object permissions, field-level security, folder access, filters, and the dashboard running user setting. Always check both the source report and the dashboard configuration when results do not match expectations.
When should an admin create a custom report type in Salesforce?
An admin should create a custom report type when the required object relationship or field selection is not available in a standard report type. Custom report types are especially useful for custom objects and business-specific relationships.
Summary of Salesforce Reports, Dashboards, and Report Types
In this Salesforce training tutorial, we learned that Salesforce reports provide structured data analysis, while Salesforce dashboards convert report results into visual components. We also reviewed report formats, dashboard components, report types, permissions, and common mistakes. In our upcoming Salesforce tutorial we are going to learn about how to use report builder in Salesforce.